As we execute our strategy for growth, reporting is structured around two key areas of focus:
- Financial measures
- Non-financial measures (Power Metrics)
Financial Measures 2025
£3,
577
m
Sales b
£
614
m
Adjusted operating profit
£
507
m
Operating profit
£1,0
69
m
Net debt
64.5
p
Adjusted earnings per share a
51.4
p
Basic earnings per share b
£
527
m
Free cash flow a
£
731
m
Net cash generated from operations b
a. See pages 235-240 for an explanation and reconciliation of these alternative performance measures and non-GAAP measures.
b. Statutory measure.
c. Source: Eikon from Refinitiv.
d. Comparatives were reinstated in 2022.
Click here to know more about the financial information.

Non-Financial Measures
Monitoring our Progress – Power Metrics
We have replaced our previous set of strategic KPIs with “Power Metrics” to make it easier to track progress against our strategic priorities.
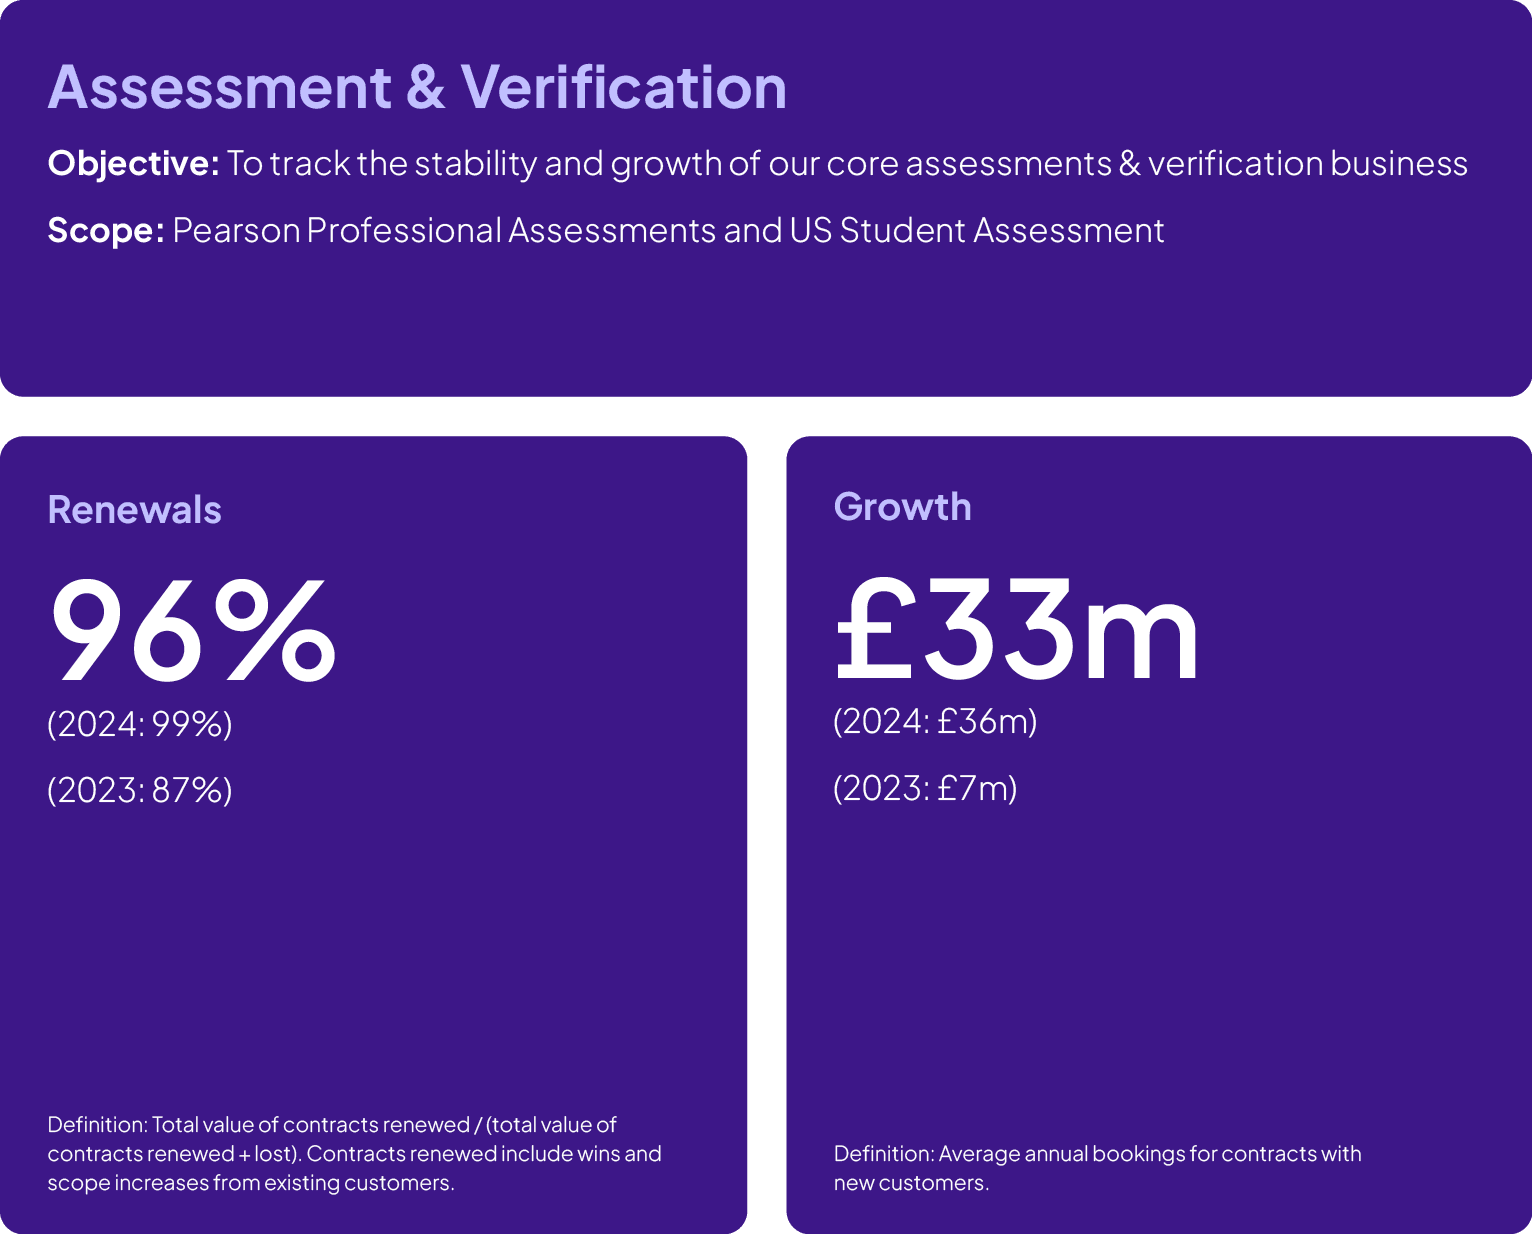
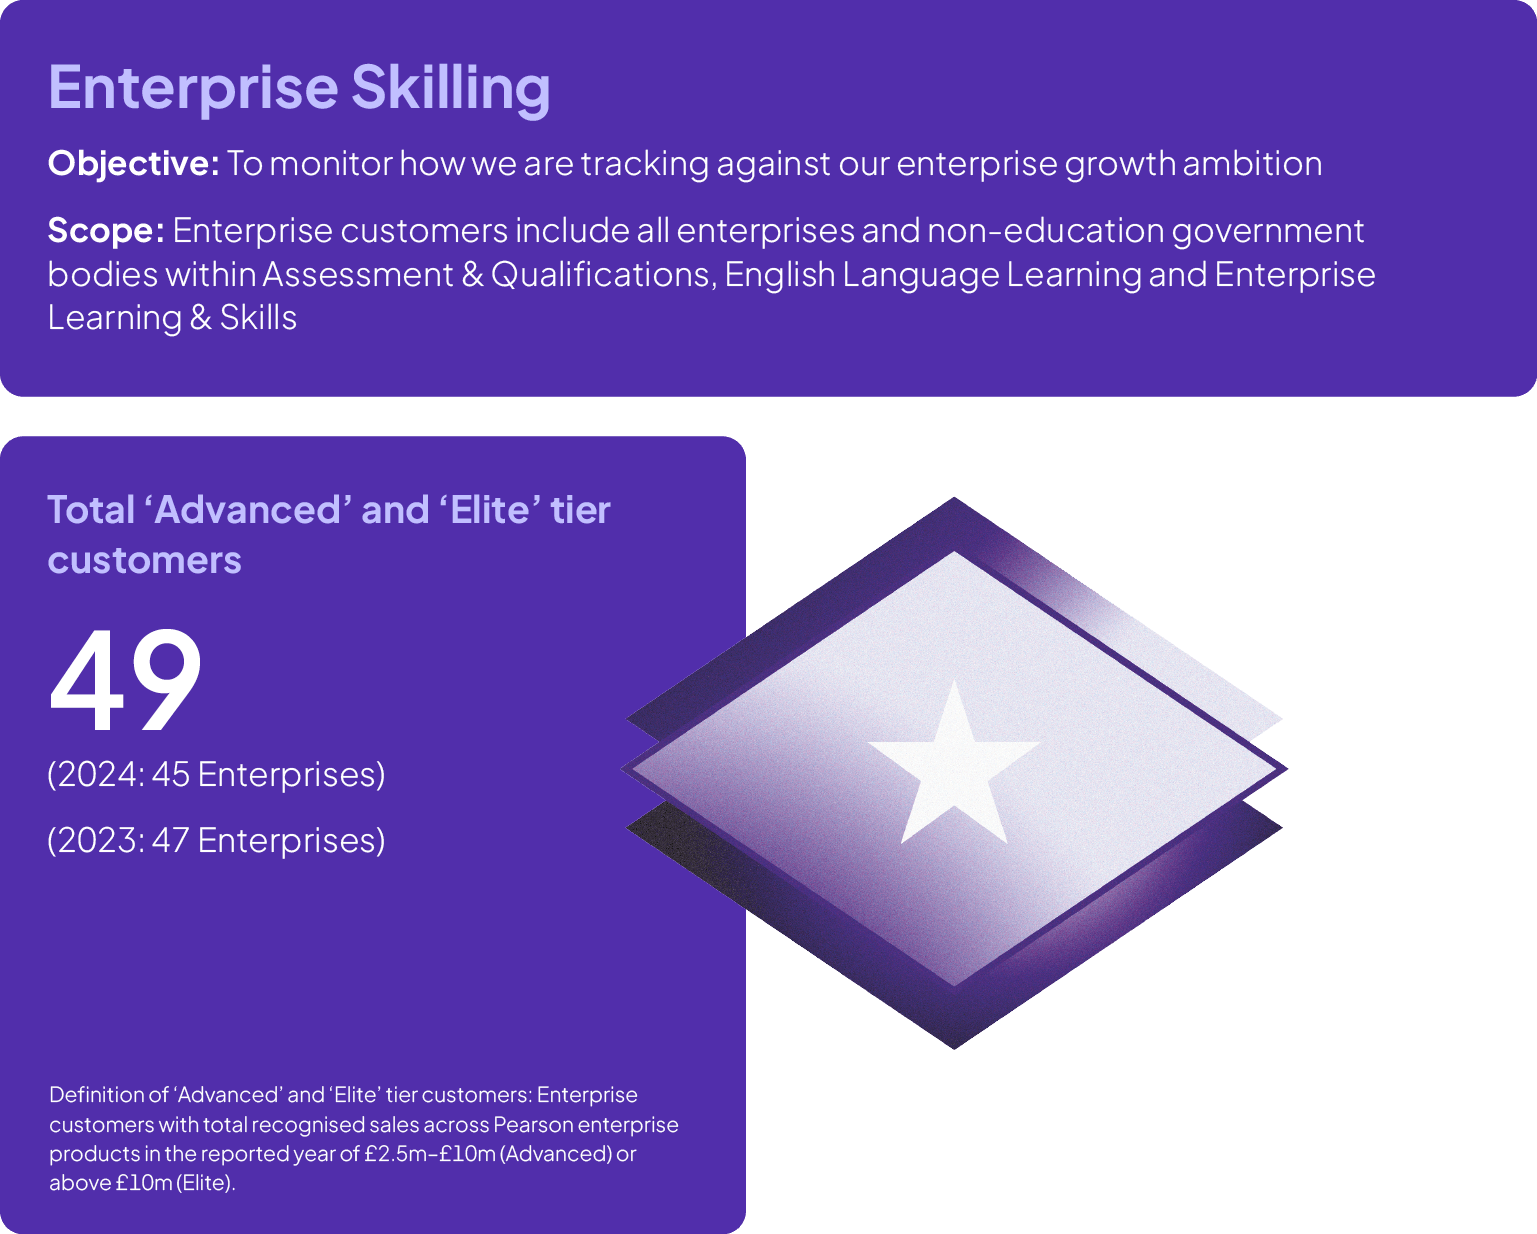
Under Assessment and Verification, we track metrics on renewal and the level of new business growth. For Enterprise, we track the number of enterprise customers in our most commercially and strategically material tiers.